 vpsmon Cloud
How to monitor a Linux VPS
Connect your VPS to a monitoring dashboard so you can see resource use over time and get notified when a server needs attention. This guide walks through setup with vpsmon Cloud, from installing its open-source agent to checking your first readings and choosing alerts.
By vpsmon Cloud · Published 10 October 2026
What should you monitor?
Start with four signals: CPU, memory, writable disk space, and whether the monitoring agent is still reporting. A single high reading needs context. Look at the history, the time of a deployment or scheduled job, and whether the reading returns to normal.
| Signal | What to look for | First check |
|---|---|---|
| CPU | Sustained high use rather than one brief spike | Open the server's live process list and look for the busiest process. |
| Memory | Usage that stays high or keeps increasing | Compare memory history with deployments and the top memory processes. |
| Disk | A writable filesystem approaching capacity | Check which mount is filling up; it may not be the root filesystem. |
| Missing samples | The agent has stopped sending readings | Check the agent service and its network connection before assuming the VPS is down. |
The screenshots below show the public demo. Server names, readings, and incidents are synthetic; your dashboard will show your own servers.
1. Check what you need
You need a Linux VPS with systemd, sudo or root access, and curl. An x86-64 or ARM64 server is a straightforward starting point. The VPS must be able to reach GitHub to download the agent and reach Cloud over HTTPS to send samples.
The agent uses outbound HTTPS. You do not need to open an inbound monitoring port or give Cloud an SSH key. Your existing firewall rules must still allow the outbound connection.
vpsmon Cloud is the hosted dashboard. Its vpsagent collects readings on each VPS. The separate open-source vpsmon app is a local, single-server dashboard; installing it does not connect a server to Cloud.
2. Create an account and add a server
Open the Cloud dashboard, create an account, and follow the verification link in your email. If registration is unavailable, contact support@vpsmon.cloud about access. You can still explore the demo without an account.
After signing in, click Add server. Keep the dialog open: it contains your install command and a one-use setup token, and it shows when the first readings arrive.
The one-day trial covers one server and begins with its first accepted sample. See the current pricing before connecting additional servers.
3. Install the open-source agent
Run the command shown in Add server in an SSH terminal on the VPS you want to monitor. The production command has this form:
curl --proto '=https' --proto-redir '=https' -fsSL https://raw.githubusercontent.com/vpsmon/vpsagent/main/scripts/install.sh | sudo bash -s -- --cloud-url 'https://app.vpsmon.cloud'
This downloads and runs the installer with administrator privileges. You can read the installer source before running it. It downloads a release binary, verifies its published checksum, and creates a dedicated systemd service.
When prompted, paste the setup token from Add server. The token is entered at the prompt, not appended to the command. Keep it private. If it expires or has already been used, reopen Add server for a fresh token.
The installer puts the agent and its helpers in /opt/vpsagent. The service starts at boot. Remote updates from Cloud are an optional feature and are not enabled by this command.
If the agent is already installed, use its update helper instead of running the installer again:
sudo /opt/vpsagent/update.sh
4. Confirm that readings are arriving
Check the service on your VPS:
sudo systemctl status vpsagent --no-pager
Look for active (running). Then return to Cloud and check that the server has a recent Last seen time and CPU, memory, and disk values. An active service alone does not prove that Cloud is receiving data; check both.
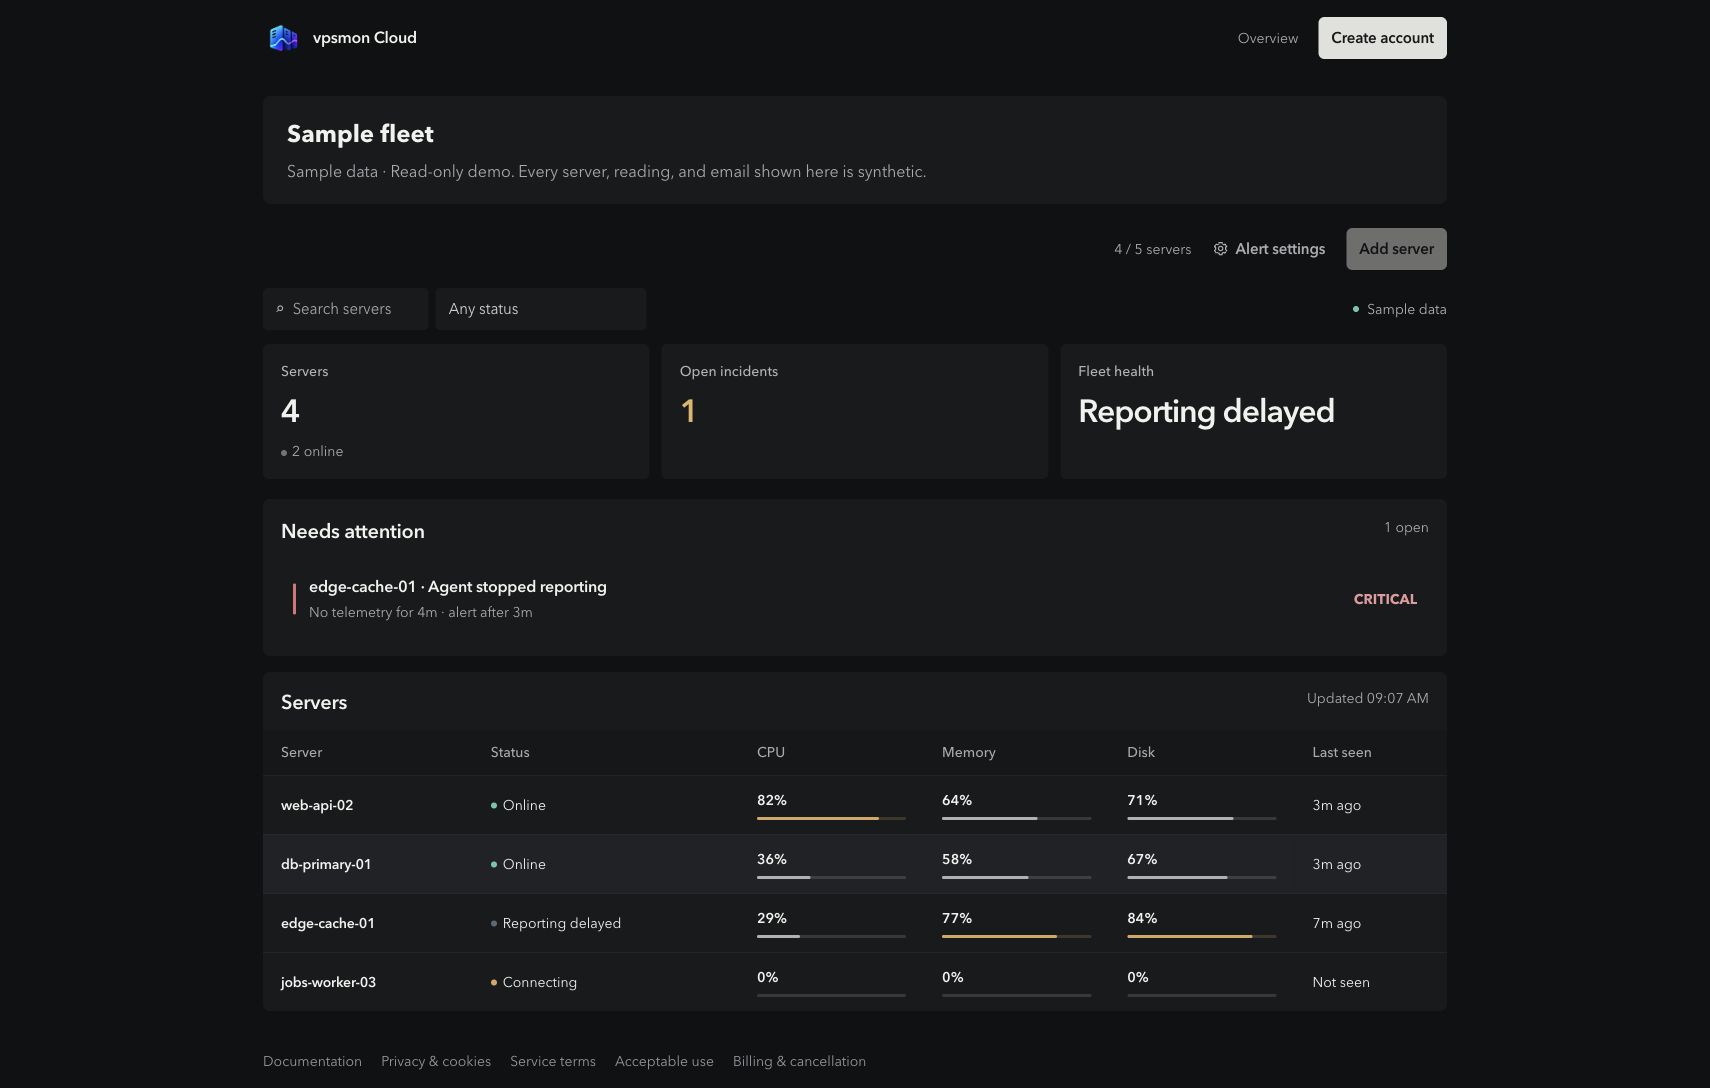
Demo fleet: one server has stopped reporting. A reporting gap can come from the agent or network even while the VPS keeps running.
The agent normally sends a sample every 15 seconds. History builds as samples arrive. If the server stays disconnected, inspect the recent service log:
sudo journalctl -u vpsagent -n 50 --no-pager
Check for connection or pairing errors. Keep tokens and credentials out of support messages. The troubleshooting reference covers missing samples and collection errors.
5. Read the history before changing the server
Click a server to open its resource chart. Switch between 4h, 24h, 7d, and 30d to compare recent activity with longer patterns. Recent data keeps individual samples; longer ranges use averages and peaks, so they are not a second-by-second record.
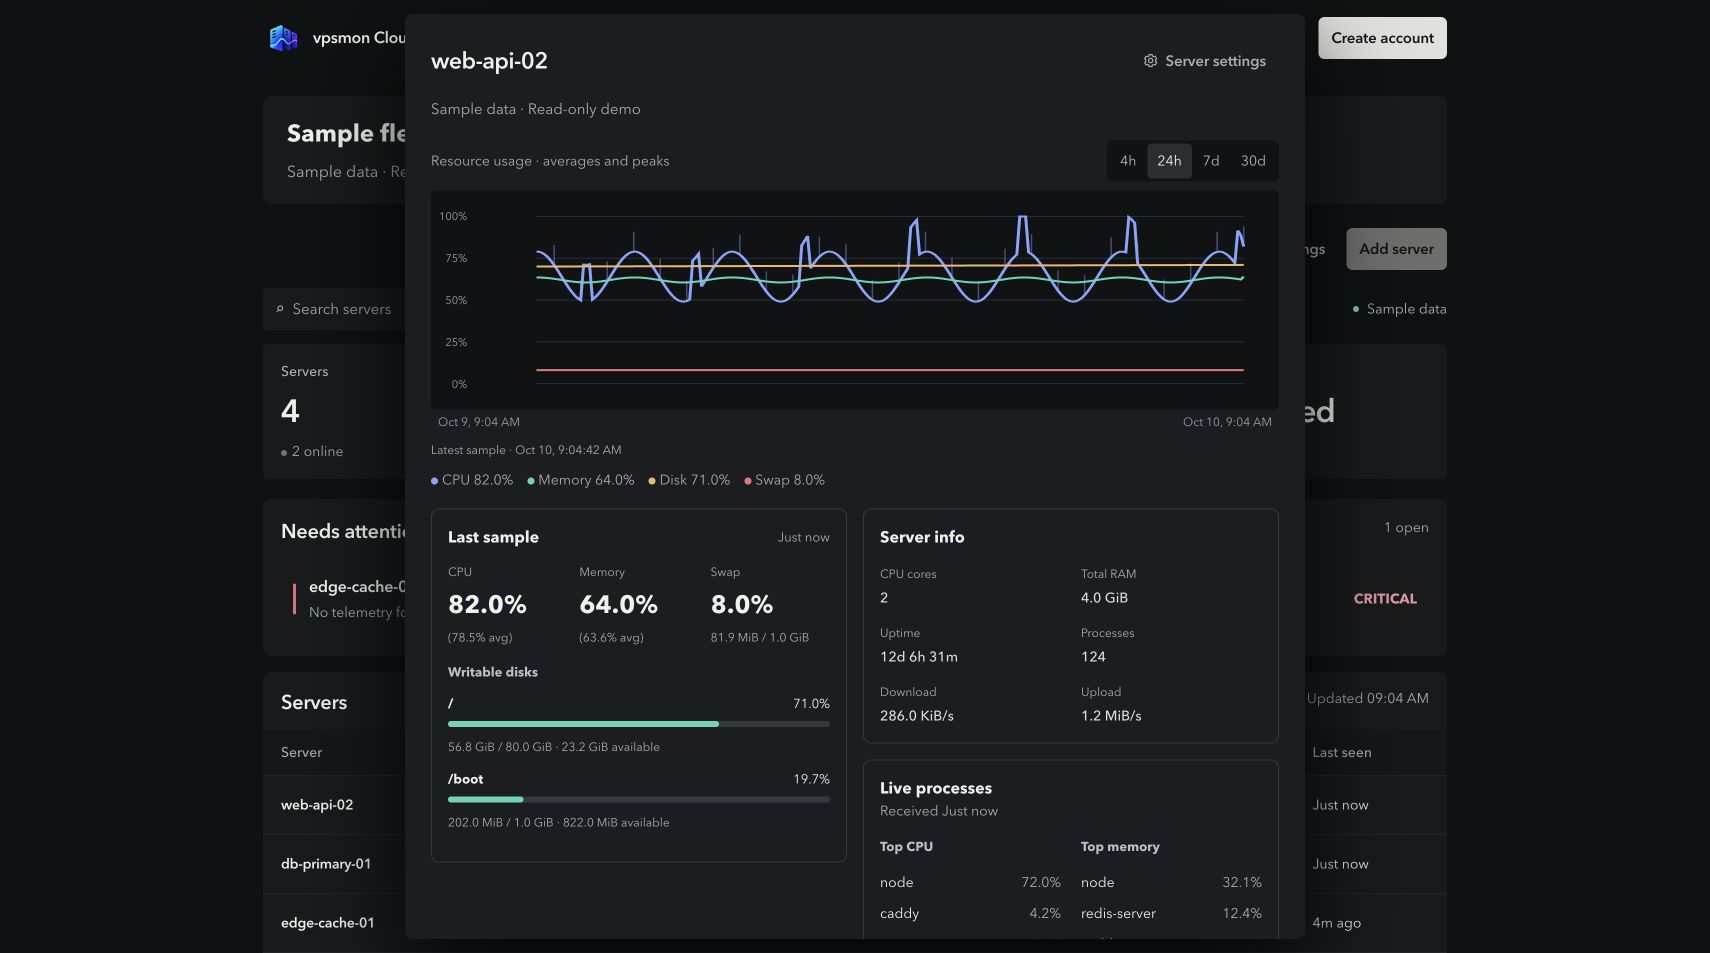
Demo server details: compare the chart with the latest readings, writable disks, and live processes. These are example values, not performance benchmarks.
For a CPU spike, check whether it persisted and which process is busy now. The live process list describes the current view; it cannot reconstruct which process caused a spike yesterday. For disk warnings, find the affected writable mount before deciding what to remove or expand.
Cloud keeps individual samples for four hours, five-minute averages and peaks up to 24 hours, and hourly averages and peaks up to 30 days. See how to read the dashboard for the full details.
6. Set alerts you can act on
Open Alert settings. New workspaces start with 90% thresholds for CPU, memory, and disk, and a 180-second timeout without telemetry. Use those as a starting point, then adjust them to the workload you observe. Thresholds apply across the workspace.
CPU and memory alerts use a one-minute average and a confirmation period, so a brief spike may not open an incident. Disk alerts use the fullest monitored writable disk. Missing-telemetry alerts mean that Cloud has not heard from the agent; they do not prove an application or website is unavailable.
Your verified signup email is the default alert recipient. Check that email alerts are enabled. If you choose another address, complete its verification. You can also connect Slack or an HTTPS webhook.
To check delivery, use a test server in a separate workspace: note its current disk reading, temporarily set the disk threshold below that reading, and wait for a new sample to trigger an incident. Check Alert history and the receiving inbox or channel, then restore the original threshold. Avoid changing shared thresholds on a production workspace just to generate a test alert. A Sent status means the provider accepted delivery, not that an email necessarily reached the inbox.
The alert reference explains confirmation times, recovery rules, and delivery failures.
How this guide was checked
The released agent installer, pairing, systemd service startup, and incoming metrics were tested on Ubuntu 24.04 ARM64 against an isolated local Cloud instance on 10 October 2026. The status and journal commands above were also run there. The screenshots use the public demo, not that test server.
Your first monitoring check
Before you leave the dashboard, confirm that the service is running, Last seen is recent, resource history is filling in, and your notification destination is verified. Check the readings again after a normal day of activity before tuning thresholds.
Explore the demo to try the interface, or open vpsmon Cloud to connect your first VPS.